by Shiva Molabanti
Oracle Business Intelligence Cloud Service (BICS) - Every organization should carefully evaluate the tool, as well as its potential for end-user adoption.
In today’s technological landscape there’s an ever-accelerating demand for increased efficiency and effectiveness. An organization, before evaluating a new solution, must consider end-user adoption for every technology prior to implementation, particularly when the cost of deployment and training are often driven by the rate of user adoption.
To enable all users to tap into the most relevant data, whenever and wherever required, Oracle has introduced, Oracle BI Cloud Service. Users who are already familiar with Oracle Business Intelligence Enterprise Edition (OBIEE) 11g will be able to adap quickly to Oracle BI Cloud Service. In some areas, Oracle BICS provides nearly identical features and functionality to OBIEE 11g. These similarities enable users to become more productive more quickly while using Oracle BI Cloud Service. OBIEE 11g users don’t need any additional special skills to adapt to BICS, existing analysis and visualization skills are enough.
What’s new?
Oracle BICS is designed with a fresh, light-weight user interface (UI) by integrating a new style called 'Skyros'. It is exciting to see how quickly Oracle is enhancing BI capabilities and visualization components to provide significant graphical and tabular capabilities for analyzing data.
Treemap View
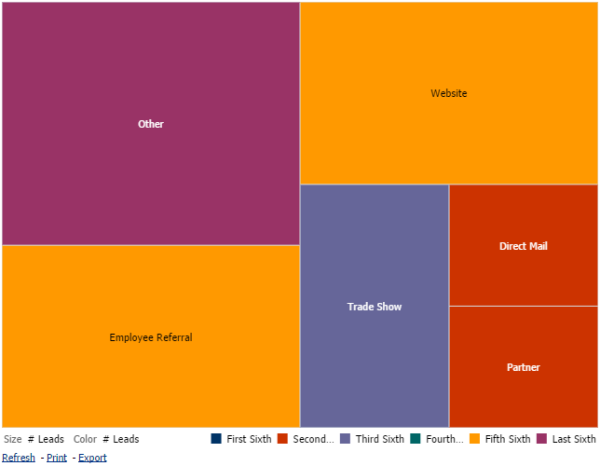
A treemap is designed to organize hierarchical data by grouping the data into rectangles (known as tiles). A treemap displays tiles based on the size of one measure and the color of the other measure.
The following figure shows an example of simple treemap view. It shows the rectangles space filled with the "Size" and "Color" proportional to the "#Leads" across different Lead Sources.

By default, the first measure of the analysis in the criteria tab is selected as, the Size By measure, and the second measure is selected, as the Color By measure. If there is only one measure in the analysis, this measure is the default for both Size By and Color By options. Additionally, the Style element defaults to Percentile Binning with "quartile" as the value for the number of bins.
Treemap view has the following characteristics:
- Tiles are colored by percentile binning or continuous color fill.
- First Group By dimension is displayed as the group (header) label.
- The order of the Group By dimensions implies the nesting order within the treemap. The last dimension in the Group By is the lowest level and this dimension name is displayed as the tile label. If the label is too long to fit on the tile, then it is truncated. Full values for the labels display in the tooltip.
Global Variables
In addition to session, Presentation and Request variables, BICS introduces a new variable called Global Variables. A Global Variable is a column created by combining a specific data type with a value. The value can be a Date, Date and Time, Number, Text, and Time.
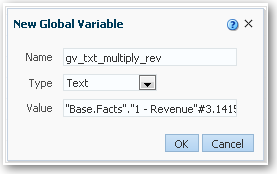
You create a global value during the process of creating an analysis by using the Edit Column Formula dialog. The global variable is then saved in the catalog and made available to all other analyses within a specific tenant system.
The global variable is evaluated at the time the analysis is executed, and the value of the global variable is substituted appropriately.

Syntax for calling Global Variables in BICS Analysis:
@{global.variables.variablename}
where variablename is the name of the global variable, for example, gv_region. When referencing a global variable, you must use the fully qualified name as indicated in the example.
For example: @{global.variables.gv_txt_multiply_rev}
Note: Only users with the BIAdvancedContentAuthor role can manage (add, edit, and delete) global variables.
 |
Shiva Molabanti is a Director of Technology at KPI Partners. He is a business intelligence enthusiast who likes blogging about acquisitions in the BI space, technical workings of BI tools, and Oracle Business Intelligence. Visit Shiva at his personal blog or check out Shiva's blog at KPIPartners.com. |


