by Kurt Wolff
If you have tried to develop dashboards or coherent sets of reports as an analytic application, you have had to think about how best to structure a web catalog.
A way to classify queries used in an analytic application is to group them according to their function: analyses that appear on dashboards, analyses that are navigation targets, analyses that provide dimensional sets, analyses that serve as triggers, and dashboard prompts.
It makes sense to structure the web catalog to reflect these five classifications. With a top level folder for each subject area, the web cat folder structure looks like this:

The advantages of this structure are that it makes it easy to separate what actually appears on the dashboards from everything else that you may need to create to make the dashboards work as you want them to.
“Analyses” will contain the largest number of objects. You may be tempted to create another level of folders under this, but in general I would argue that another level of folders just complicates the task of finding things.
By putting navigation targets in their own folder, they are not only easier to find (and protect), but if you have to migrate objects from one catalog to another, this structure makes it easier to migrate these objects first. When you migrate the other analyses their navigation targets will already be in the new web catalog (thus avoiding error messages you will receive if the navigation targets do not exist).
The “Prompts” folder contains dashboard prompts. I find that I constantly separate these out, mentally, when they are intermingled with analyses that provide results and data visualizations. Putting them in their own folder saves me from continually having to do that.
Sets are simply queries that provide dimensional members when you create a filter using the Advanced|Filter based on results of another request option. Users never see them directly, but their use can be critical, especially when you have analyses that contain filters on measures and that also contain grand totals.

The “Triggers” folder contains another group of queries that users never see. These are simple queries that take a sub-second to execute and whose results (or lack of results) cause dashboard sections to appear or disappear, so-called “Guided Navigation Sections”. (Note: queries in a Guided Navigation sections still run when the user clicks on a dashboard page, even if the Guided Navigation section has not been triggered to appear. Hopefully, in the not too distant future, Oracle will correct this behavior.)
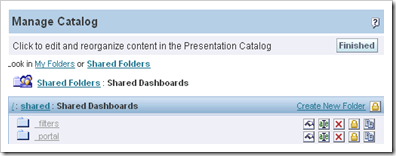
Dashboards themselves can exist in their own folder or can be grouped together in a common Shared Dashboards folder. The basic objective is to create a structure that makes assigning correct permissions to dashboards as easy as possible without inadvertently assigning permissions you do not intend. Since dashboards can (and often do) contain analyses that refer to more than one subject area, separating dashboards from the folders built around subject area content seems logical.
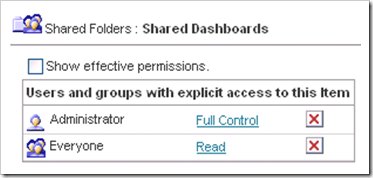
If you use a common Shared Dashboards as the outer folder for dashboards, give Everyone Read permission to it.

Then give Everyone Read permission to the _portal folder.

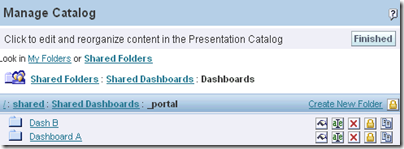
Finally, assign the appropriate permissions to each dashboard in the _portal folder.


